Two Charts Become One
문제
When businesses feel that they are a little bloated and in need of restructuring, they call in the well-known reorganization consultant Don Sizing. One of the first things Don asks for is a chart showing the hierarchy of departments in the business, i.e., which departments are in charge of other departments. Often there will be some confusion about this hierarchy and Don will end up with two or more different charts displaying the same set of departments. In situations like this Don must determine if the charts are similar, i.e., if they show the exact set of hierarchies while not necessarily being drawn the same way. For example, consider the two charts shown on the left in Figure K.1. While they do not look the same, they do represent the same hierarchies -- department is in charge of departments and and department is in charge of departments , and . The three charts on the right in Figure K.1 are all truly different, each representing different hierarchies.
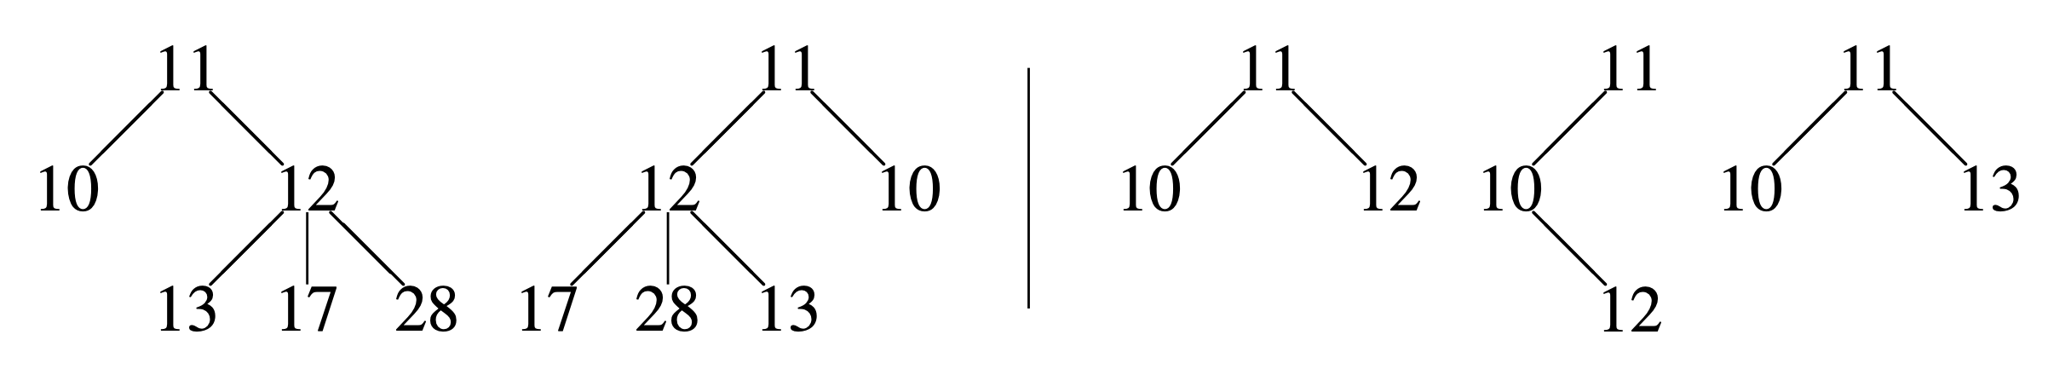
Figure K.1: Two sets of hierarchical charts.
For companies with small numbers of departments, determining whether two charts are the same is relatively simple, but for larger companies it can be rather difficult. Don has sized up this problem and decided he needs some software to solve this problem for him.
입력
Input consists of two lines, each representing one hierarchical chart. The syntax for a hierarchical chart is the following:
- a department number
dby itself is a hierarchical chart - the string \verb+d (c1) (c2) ... (cn)+ is a hierarchical chart, where
dis a department number andc1, c2, ..., cnare hierarchical charts.
Case 2 represents the case where department d is in charge of the departments at the top of the hierarchies c1, c2, ..., cn. Each input line will contain at most departments and no department will be in charge of more than other departments. All department numbers are integers between and . We say that a hierarchical chart described by case 1 has leadership depth , and a hierarchical chart described by case 2 has leadership depth equal to one plus the maximum leadership depth of the hierarchical charts c1, c2, \dots, cn. The input will have a leadership depth at most . There may be any number of spaces on either side of an opening or closing parenthesis.
출력
Output Yes if the two hierachical charts are similar and No otherwise.
예제
예제 1
11 (10) (12 (13) (17) (28))
11 (12 (17) (28) (13)) (10)
Yes
예제 2
11 ( 10 ) ( 12 )
11(10(12))
No
예제 3
11 (10) (12)
11 (10) (13)
No